Google Analytics has a very interesting nice feature: it is possible to use it for A/B testing, and in a nice client-side way that just uses javascript. I am using this to improve my keto calculator website. An interesting feature is that google uses a multi-armed bandit implementation, which optimizes the A/B split ratio while optimizing.
Unfortunately, Google’s implementation is quite buggy. Here are a few problems that I ran into while testing:
Inaccurate Number
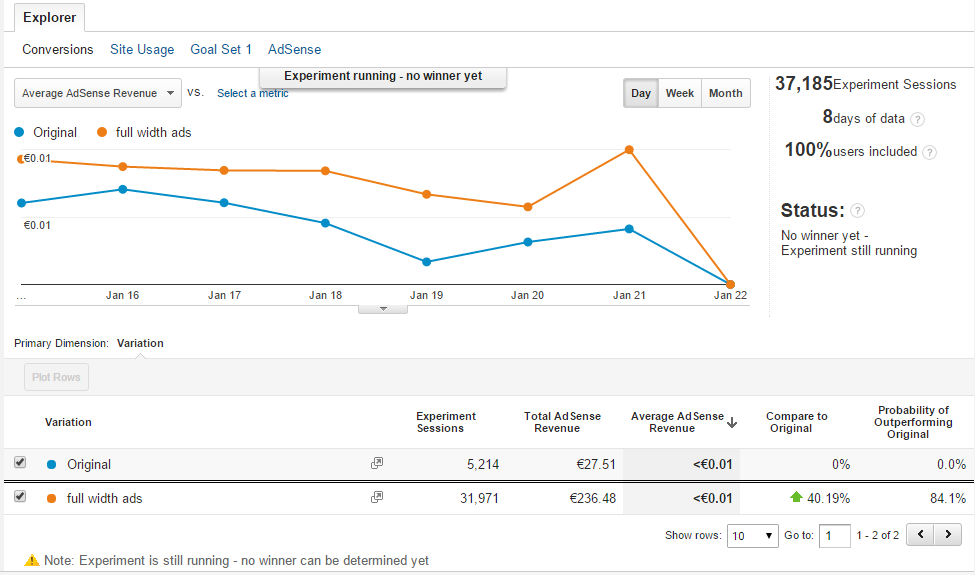
While testing, Google Analytics shows a “Probability of Outperforming Original”. This number can is often incorrect, and does not match with what is actually used for the homepage A/B split ratio. It seems that the numbers in the Analytics UI is calculated based on data that is only partly up-to date. In reality the probability should is at least 99%, but the UI shows 84.1%. The number is updated about twice a day, and it jumps around wildly even though there is not much change in the relative ratio between A and B test.
Incorrect Graphs
The above graph is sometimes not up to date. It seems that the graph data can be delayed for 1-2 days. Sometimes it shows the current days as no data, even though it’s already recorded in the “Adsense” view.
By the way, when optimizing for Adsense Revenue, it seems that the “AdSense” view is much more accurate than the “Conversions” view. What really counts is the “AdSense eCPM” value (which by the way should be renamed to RPM).
Incorrect/Inaccurate Results with Multiple Variants
I’ve tried to use the multi-armed bandit to find the optimum variant out of 20 different ones. It seems that this has failed completely. While having a look at the experiments.js file that google integrates, it can be seen that some variants had a probability to be chosen of 0, so they were not at all considered any more. With multi-armed bandit Google usually has a selection probability for each variant that is exactly the probability of it outperforming the original. The javascript file for the above screenshot contains this data:
"api_version": "V1",
"method": "experiments.get",
"data": {
	"kind": "cx/api#experiment",
	"id": "xxxxxxxxxxxxxxxxxxxxxx",
	"self_link": "/cx/api/V1/experiments/xxxxxxxxxxxxxxxxxxxxxx",
	"updated": "2016-01-22T00:36:33.752Z",
	"participation": 1,
	"items": [{
		"kind": "cx/api#combination",
		"id": "0",
		"weight": 0.019,
		"disabled": false
	}, {
		"kind": "cx/api#combination",
		"id": "1",
		"weight": 0.98099999999999998,
		"disabled": false
	}]
}
So even though the screenshot says a 84.1% probability of outperforming, the file has a selection probability of the variant of 98.1% which should be more correct. In my test with 20 variants, about 10 variants had a weight of 0, which means that they were never shown to the user. When I noticed this, I added my own selection code (in 50% of the cases, just randomly present a variation to the user) so that the 0 probability variants have a chance to be actually visible to some users, and while this had some effect on the results, it still seemed that the multi-armed bandit just can not deal with so many variants at the same time. Some variants which are actually very similar got a completely different probability of outperforming the original.
Verdict
All in all Google Analytics is really excellent for A/B testing, but has a few quirks that one should be aware of. When A/B testing, a Chi-Square test for comparison is always helpful. E.g. a Chi-Squared test of click through ratio of the above example (ok, it’s not the same as testing AdSense Revenue like google does, but the difference should be marginal in my case) shows that with a confidence level of 99% we can say that the variant is more successful.