While cleaning up my blog I have found an old ruby program from 2005: rtd.rb. What this does it it can create pretty graphs from ruby class hierarchy. Interestingly, it still works ![]()
It is quite easy to use, here is a small tutorial:
Usage Tutorial
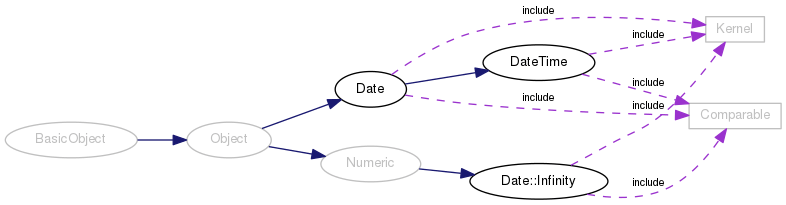
- Generate graph for the ruby module
time. Create a filertd-time.rbwith this content:require "./rtd.rb" stats = RubyToDot.new stats.hide_current_state require 'time' puts stats.generateNow run this command (requires
dot, install in Ubuntu withsudo apt install graphviz):ruby rtd-time.rb | dot -Tpng >time.pngThe generates this graph:
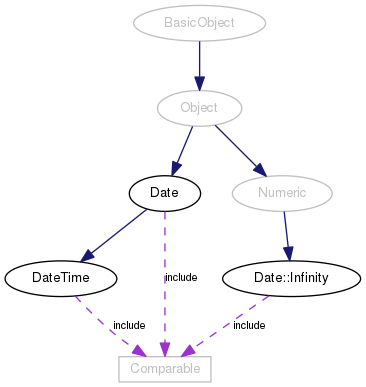
- This does not yet look very nice. Let hide the module
Kernel, and draw the graph from top down:require "./rtd.rb" stats = RubyToDot.new stats.hide_current_state require 'time' stats.hide(Kernel) stats.left_to_right = false puts stats.generateThis is the generated graph:
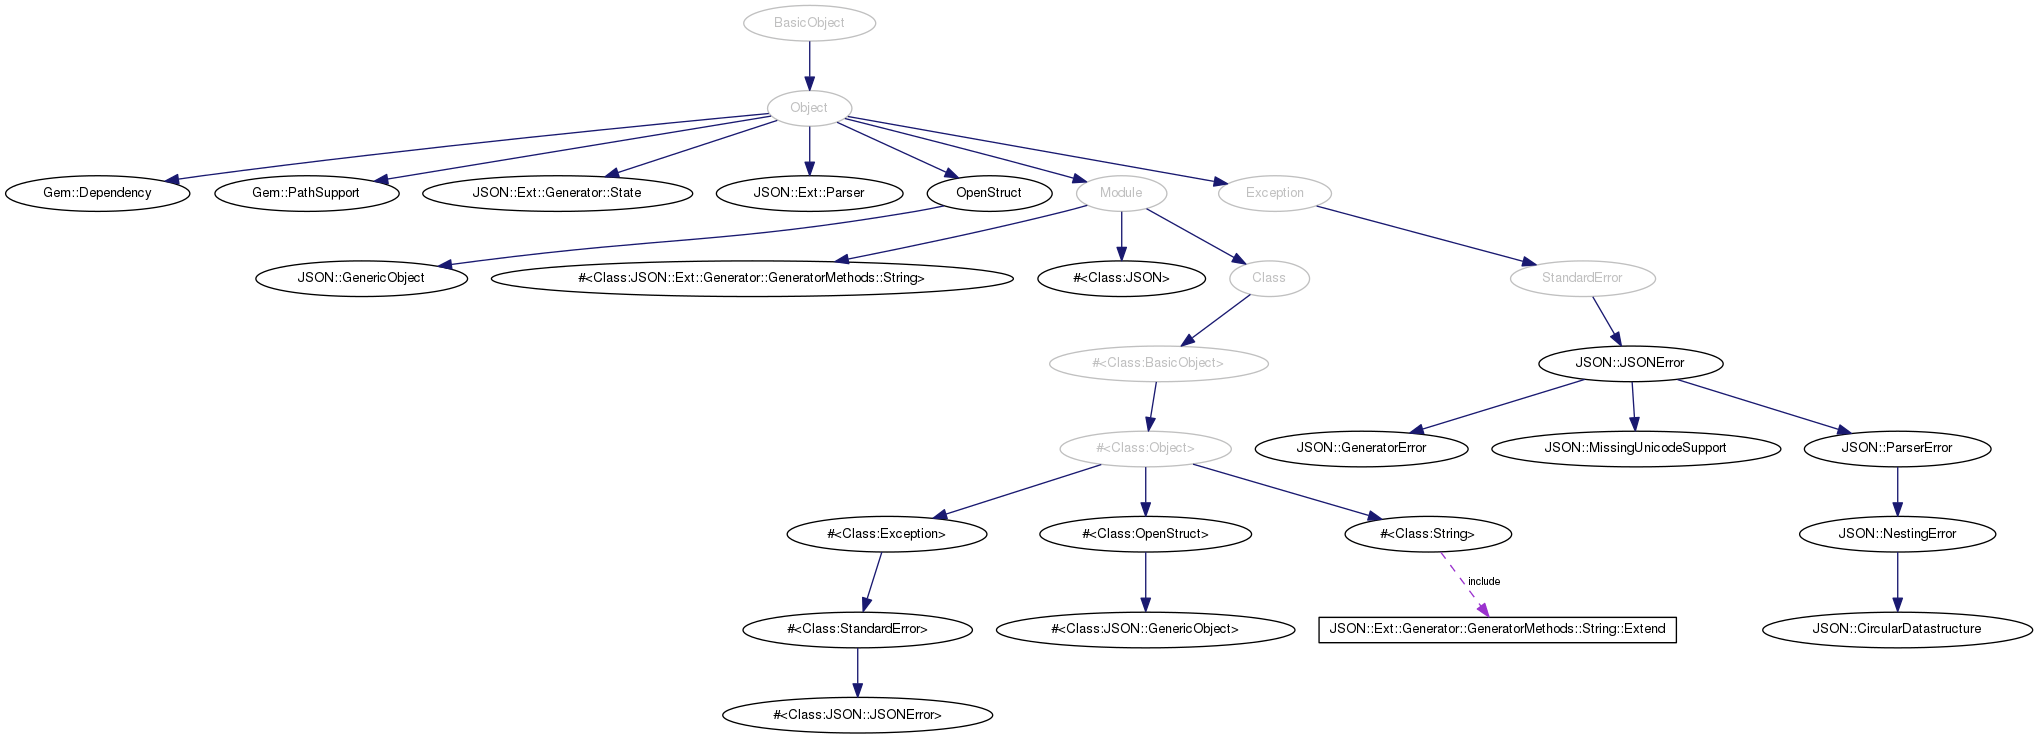
json Example
For larger modules the graph can get pretty complex. E.g. here is a graph for JSON. I’ve hid the modules Kernel and JSON::Ext::Generator::GeneratorMethods::Object. Click to enlarge:
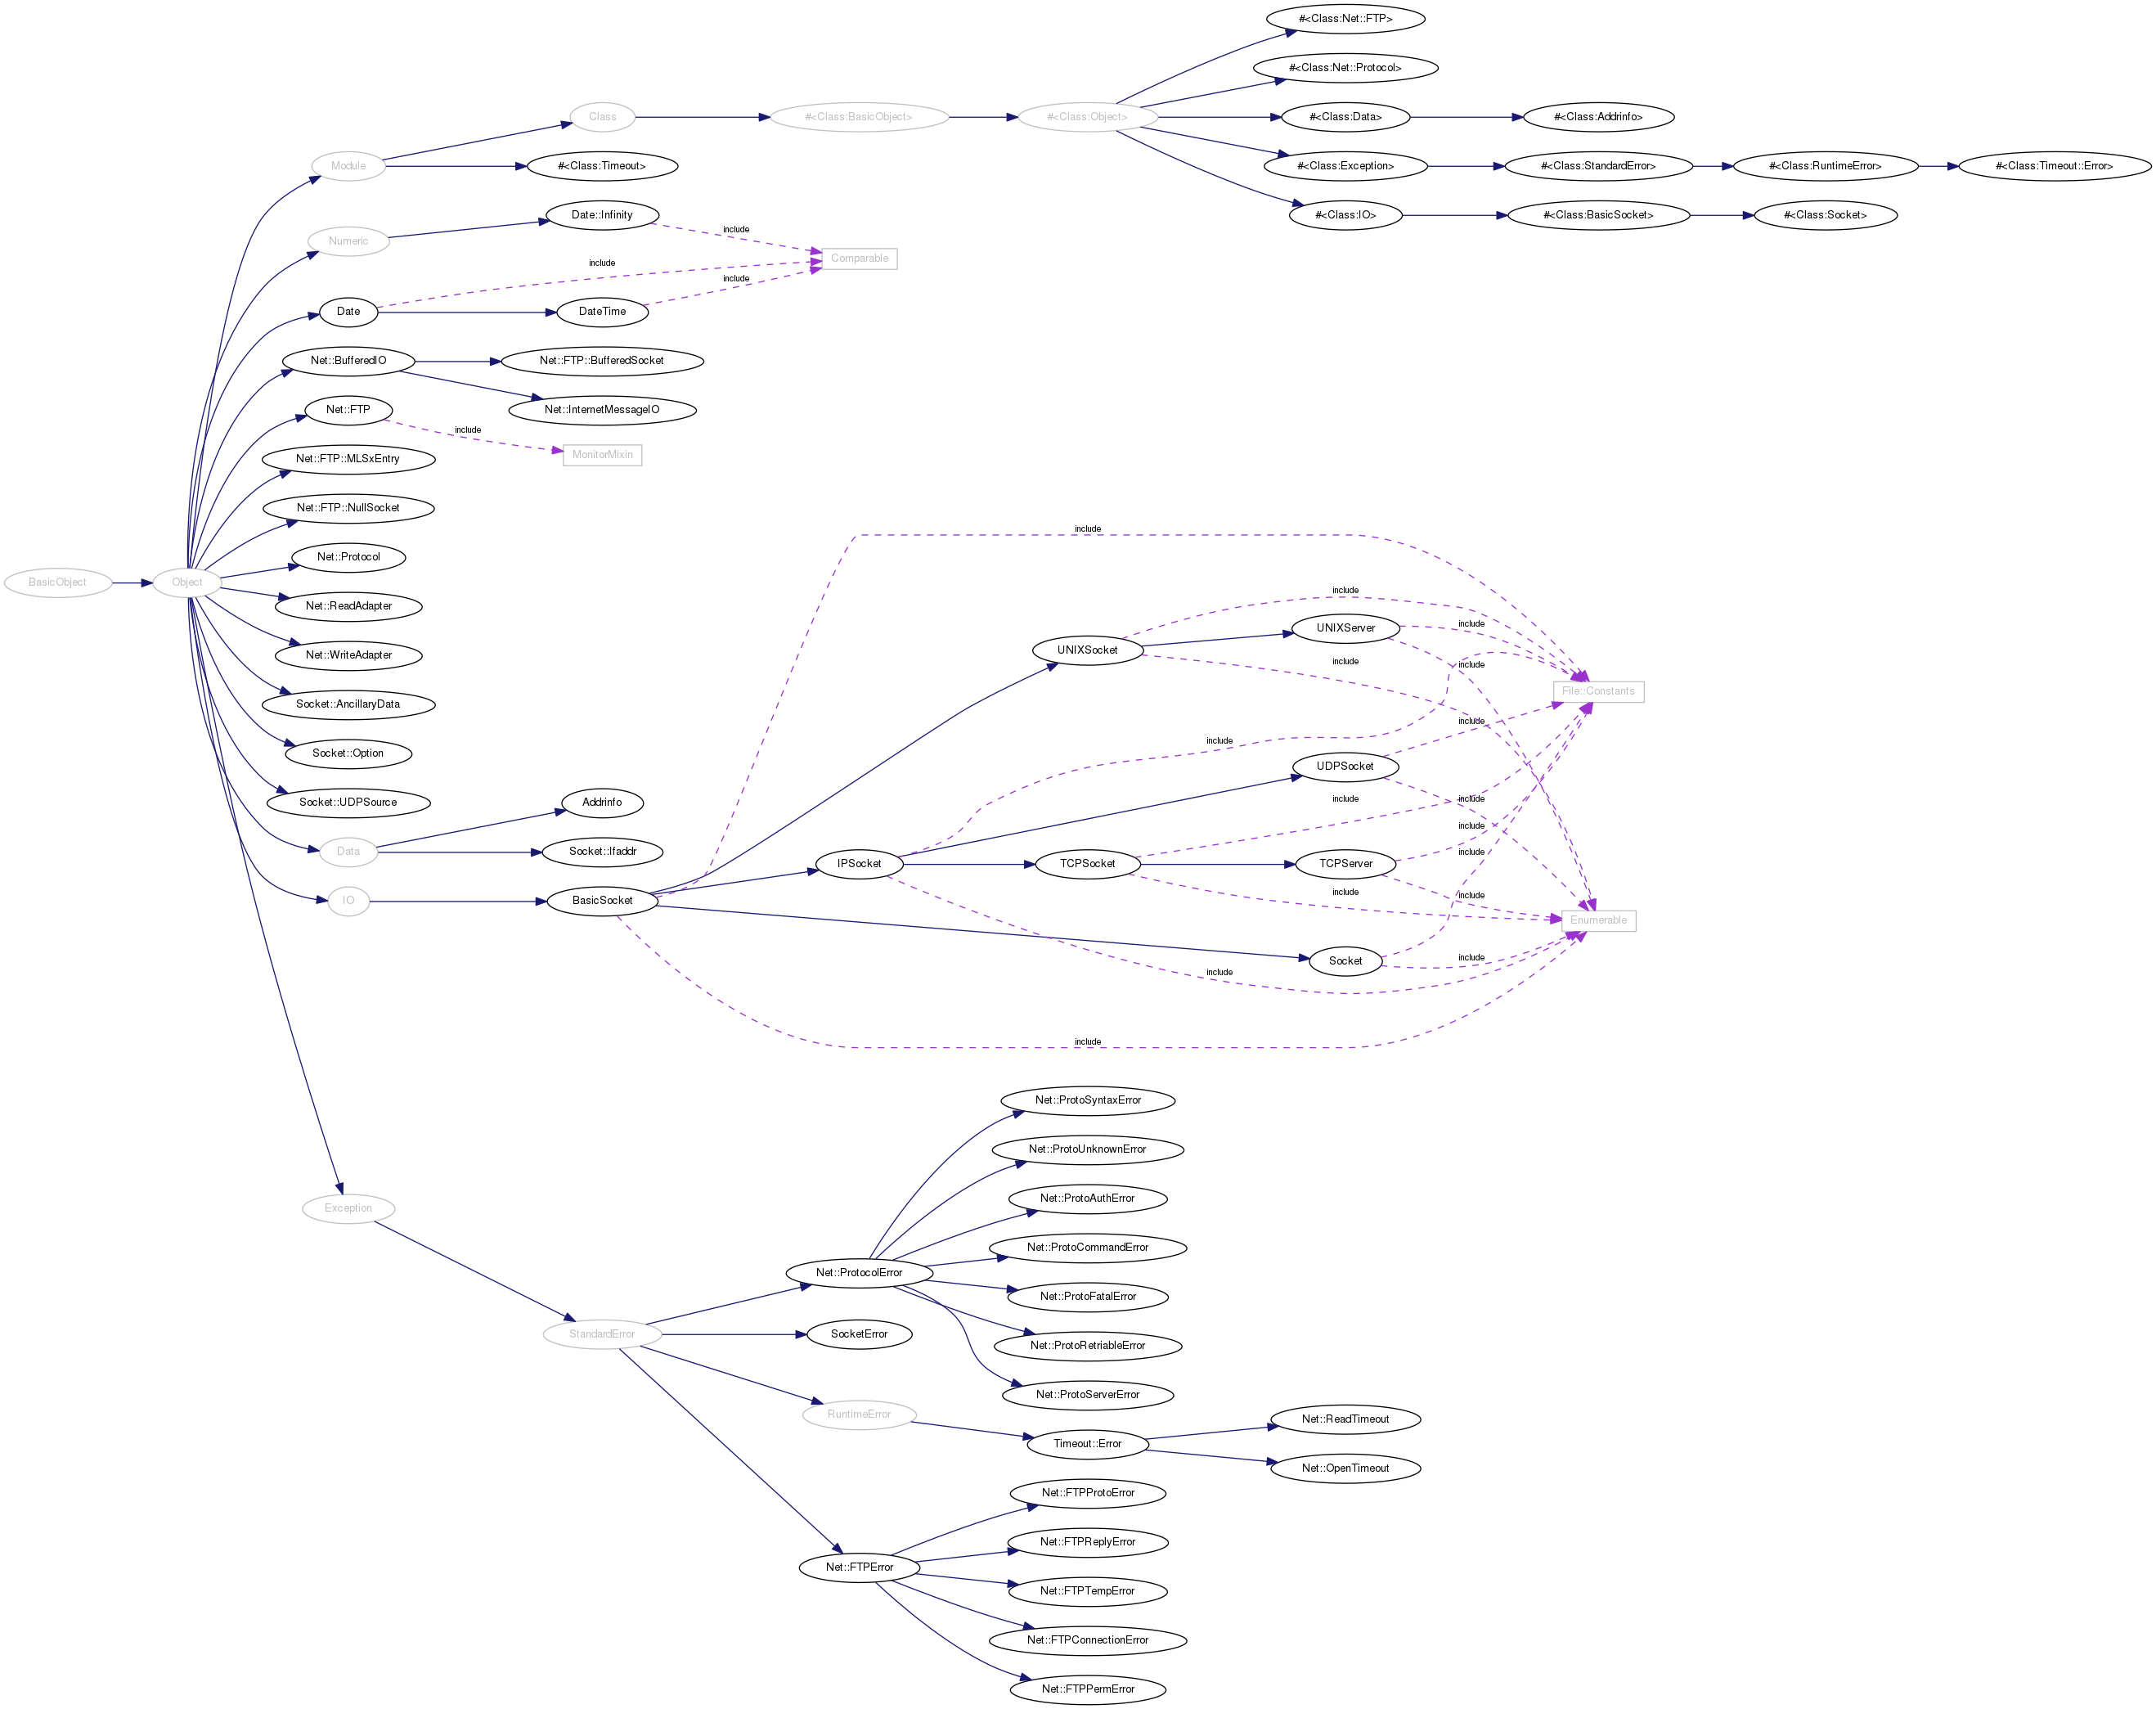
net/ftp Example
Another graph for net/ftp:
Please post if this is useful to you!